.
Quality
Enterprise Dashboards
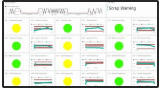
Gain insights with real time Key Performance Indicators (KPIs) by displaying them in dashboards that tell stories about your processes. This video provides a snapshot of some visuals for quality indicators that everyone can rally around when tracking performance to goals and bench-marking breakthrough performance.
Predictive Analytics / Business Intelligence (BI)
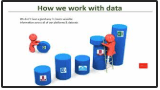
So many of us have disjointed data sets which make it difficult to visualize what our data is telling us when we create and view reports. We can create dashboards by using tools we are already familiar with, like Excel.
What If
Simulation App

What if you could replay the day in your manufacturing or processing facility, in order to improve the quality of products that are produced? What if you could reduce, or even eliminate, scrap by only asking
“What If”
“What If”
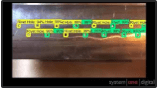
Visual Defect Classification
Eliminate the need for physical inspections by monitoring product quality using computer vision and Artificial Intelligence (AI) using visual classification. This model uses automation and groundbreaking technologies to identify where defects appear on the product as it rolls out onto the conveyor belt.
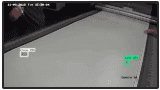
Autonomous Product Quality Monitoring
Eliminate the need for physical inspections by monitoring product quality using computer vision and Artificial Intelligence (AI) using object detection. This model uses automation and cutting-edge technologies to identify where rivet holes have properly been secured with rivets.
Internet of Things
(IoT)

System One Digital has many examples of our solutions. We leverage Digital Transformation, Artificial Intelligence (AI), the Internet of Things (IoT) and other cutting-edge technologies to achieve your goals.